Life Expectancy and Longevity
http://www.humantruth.info/life_expectancy.html
By Vexen Crabtree 2020
#demographics #health #hong_kong #immigration #japan #life_expectancy #longevity #population
Increasing longevity, and subsequent aging, is a long-term trend around the world1. Global life expectancy has risen above the 70s, reaching 72, by 20162, as part of a global trend towards better health2,3, and due to huge portions of the world being gradually lifted out of poverty. It also reflects overall improvements to cultural health, including diet, health services systems, attitudes to exercise and well-being, and also family structure and caring. For decades, Japan was well-known for having the highest average life expectancy4, until the top spot was taken by Hong Kong. The regions with the best life expectancy are Europe (78.4), The Middle East (75.2) and Asia (73.2)5 and the worst, by some way, is Africa (62.8)5.
One effect of rising longevity is the 'demographics crisis'; where an increasing portion of the population is old and retired, putting pressure on services and taxes6. The solution is for aging countries to import younger workers from elsewhere; over time, as birth rates stabilize, geriatric care improves the length of the working life, and population growth calms, this situation will stabilize.
- International Statistics
- The Demographics Crisis (The Increase in Life Expectancy is Raising the Old Age Dependency Ratio)
- Life Expectancy Inequality
- Genetics
- Setbacks to Long Life
- Sociological Data on Life Expectancy Versus Religion
- Links
1. International Statistics
#1990s #2000s #2010s #health #life_expectancy #longevity
“Global life expectancy at birth in 2016 was 72.0 years (74.2 years for females and 69.8 years for males), [... It] increased by 5.5 years between 2000 and 2016, the fastest increase since the 1960s. Those gains reverse declines during the 1990s, when life expectancy fell in Africa because of the AIDS epidemic, and in Eastern Europe following the collapse of the Soviet Union. The 2000-2016 increase was greatest in Africa, where life expectancy increased by 10.3 years to 61.2 years, driven mainly by improvements in child survival, and expanded access to antiretrovirals for treatment of HIV.”
World Health Organisation (accessed 2020)2
| Life Expectancy Higher is better5 | |||||
|---|---|---|---|---|---|
| Pos. | 2021 Years5 | 2010s Avg | 2000s Avg | 1990s Avg | |
| 1 | Monaco | 85.9 | 85.4 | 83.4 | 78.4 |
| 2 | Hong Kong | 85.5 | 84.2 | 81.7 | 78.9 |
| 3 | Japan | 84.8 | 83.7 | 82.1 | 79.9 |
| 4 | Australia | 84.5 | 82.7 | 80.8 | 78.1 |
| 5 | Switzerland | 84.0 | 83.0 | 81.1 | 78.6 |
| 6 | Malta | 83.8 | 82.5 | 79.3 | 76.6 |
| 7 | S. Korea | 83.7 | 82.3 | 78.5 | 73.9 |
| 8 | Liechtenstein | 83.3 | 82.8 | 80.7 | 77.3 |
| 9 | Norway | 83.2 | 82.1 | 79.9 | 77.7 |
| 10 | Spain | 83.0 | 82.7 | 80.4 | 78.1 |
| 11 | Sweden | 83.0 | 82.2 | 80.5 | 78.6 |
| 12 | Italy | 82.9 | 82.7 | 80.8 | 78.0 |
| 13 | Singapore | 82.8 | 82.7 | 80.1 | 76.4 |
| 14 | Iceland | 82.7 | 82.3 | 81.0 | 78.7 |
| 15 | Canada | 82.7 | 81.9 | 80.1 | 78.1 |
| 16 | Luxembourg | 82.6 | 81.5 | 79.1 | 76.4 |
| 17 | France | 82.5 | 82.2 | 80.2 | 77.8 |
| 18 | New Zealand | 82.5 | 81.8 | 79.6 | 76.8 |
| 19 | Israel | 82.3 | 82.2 | 80.1 | 77.8 |
| 20 | Finland | 82.0 | 81.1 | 78.9 | 76.4 |
| q=195. | |||||
| Life Expectancy Higher is better5 | |||||
|---|---|---|---|---|---|
| Pos. | 2021 Years5 | 2010s Avg | 2000s Avg | 1990s Avg | |
| 195 | Chad | 52.5 | 51.4 | 48.3 | 46.5 |
| 194 | Nigeria | 52.7 | 51.9 | 49.0 | 45.8 |
| 193 | Lesotho | 53.1 | 50.3 | 44.6 | 56.1 |
| 192 | Central African Rep. | 53.9 | 52.1 | 46.5 | 47.6 |
| 191 | S. Sudan | 55.0 | 55.5 | 50.5 | 30.6 |
| 190 | Somalia | 55.3 | 54.2 | 50.8 | 45.4 |
| 189 | Swaziland | 57.1 | 53.9 | 44.1 | 56.7 |
| 188 | Ivory Coast | 58.6 | 57.3 | 52.0 | 51.7 |
| 187 | Guinea | 58.9 | 58.2 | 54.4 | 49.7 |
| 186 | Mali | 58.9 | 58.1 | 53.5 | 48.0 |
| 185 | Congo, DR | 59.2 | 58.4 | 53.7 | 49.6 |
| 184 | Zimbabwe | 59.3 | 57.9 | 45.0 | 52.0 |
| 183 | Namibia | 59.3 | 59.9 | 52.5 | 58.5 |
| 182 | Burkina Faso | 59.3 | 58.5 | 53.0 | 49.6 |
| 181 | Mozambique | 59.3 | 57.7 | 51.5 | 46.2 |
| 180 | Guinea-Bissau | 59.7 | 58.8 | 52.5 | 48.1 |
| 179 | Benin | 59.8 | 59.3 | 57.1 | 55.0 |
| 178 | Sierra Leone | 60.1 | 57.1 | 48.4 | 43.3 |
| 177 | Cameroon | 60.3 | 59.2 | 54.4 | 53.6 |
| 176 | Equatorial Guinea | 60.6 | 59.8 | 55.3 | 51.6 |
| q=195. | |||||
By region and category, showing changes over the past six years:
| Area | Life Expectancy (2021) Higher is better Years5 | Life Expectancy (2015) Higher is better Years5 | |
|---|---|---|---|
| Africa... | 62.79 | 61.59 | |
| Asia... | 73.48 | 73.18 | |
| Australasia | 70.11 | 72.07 | |
| Baltic States | 74.81 | 74.95 | |
| Central America | 72.52 | 74.47 | |
| Europe... | 78.36 | 78.36 | |
| Melanesia | 68.32 | 68.28 | |
| Micronesia | 66.61 | 69.46 | |
| North America | 72.98 | 74.94 | |
| Polynesia | 72.69 | 76.23 | |
| Scandinavia... | 81.58 | 80.87 | |
| Small Islands... | 71.86 | 73.34 | |
| South America | 71.82 | 74.13 | |
| The Americas... | 72.58 | 74.66 | |
| The Balkans | 75.44 | 76.71 | |
| The Caribbean... | 72.37 | 74.14 | |
| The Mediterranean | 77.77 | 77.50 | |
| The Middle East... | 75.14 | 74.92 | |
| World | 71.28 | 71.27 | |
Although a lot of the smaller regions have suffered reduced life expectancy, some of the largest groupings (Asia and Africa) have improved. Asia's +0.3 change alone, with a total population of 4.5 billion, is enough to keep the world's average change above 0.
The main factor in increasing life expectancy in recent decades has been improvements in childhood mortality2,7.
“Although both preventive medicine and direct intervention can be effective in thwarting disease, prevention is generally less aversive and less expensive. It can also be more effective. Many people are surprised to learn that relatively little of the improvement in health and longevity during the last two hundred years is due to drug and surgical treatment of sick individuals. Most of the gain is attributable to various preventive measures such as improved sewage disposal, water purification, the pasteurization of milk, and improved diets. In fact, our greater longevity is mainly due to our increased chances of surviving childhood, chances increased by these very preventive measures and by the introduction of vaccines for the infectious diseases of youth. The life expectancy of those who make it to adulthood has not changed much during the last hundred years. The life expectancy of a 45-year-old man in the nineteenth century was roughly 70 years, a figure not much different from that of today.”
"How We Know What Isn't So: The Fallibility of Human Reason in Everyday Life" by Thomas Gilovich (1991)7
2. The Demographics Crisis (The Increase in Life Expectancy is Raising the Old Age Dependency Ratio)
#economics #germany #italy #japan #longevity #pensions #population #portugal
Throughout Human history, grandparents have been vastly outnumbered by the young. If you maintain a strong workforce aged 25-64 relative to the size of the rest of the population, the result is an 'economic dividend' which is the most effective way to boost national finances"World Population Prospects 2019 Highlights" by the UN (2019b)8. Many experience this as fertility rate falls"World Population Prospects 2019 Highlights" by the UN (2019b)8.
But this millennium, countries are entering a wizened era where increasing longevity is resulting in larger old-age (65+) populations3. The old-age dependency ratio compares this group to those of working age (15-64); 12 countries have a ratio of over 4 to 10, impacting on pensions, housing, health services and social structures, which are all struggling to cope. In the case of pensions, the whole system is threatening to fail as it becomes impossibly expensive.
Japan had been ahead of the trend for a great while; it is now followed by Italy, Germany and Portugal9.
There are two answers: Prevent runaway population growth (which delays the problem, but makes it worse in the end), and, spread out the young between countries through open labour markets - immigration increases tax revenues to pay for services for the old, and, also provides the answer to the labour shortage that threatens aging countries - Japan's impressive automation robots are slow to develop and expensive. No doubt, the true economic solutions to such complicated problems have not yet been found.
For more, see:
3. Life Expectancy Inequality
#equatorial_guinea #health #inequality #life_expectancy #maldives #solomon_islands #USA #venezuela
| Inequality in Life Expectancy (2019)10 | ||
|---|---|---|
| Pos. | Higher is worse10 | |
| 184 | Chad | 40.90 |
| 183 | Central African Rep. | 40.10 |
| 182 | Sierra Leone | 39.00 |
| 181 | Somalia | 38.90 |
| 180 | Nigeria | 37.10 |
| 179 | Mali | 36.70 |
| 178 | S. Sudan | 36.20 |
| 177 | Congo, DR | 36.10 |
| 176 | Benin | 34.90 |
| 175 | Equatorial Guinea | 34.60 |
| 174 | Cameroon | 33.50 |
| 173 | Ivory Coast | 33.30 |
| 172 | Lesotho | 33.10 |
| 171 | Guinea-Bissau | 32.30 |
| 170 | Haiti | 32.20 |
| 169 | Burkina Faso | 32.00 |
| 168 | Angola | 32.00 |
| 167 | Guinea | 31.30 |
| 166 | Niger | 30.90 |
| 165 | Togo | 30.50 |
| q=184. | ||
Inequality in life expectancy is tied with the overall imbalance of power, resources and wealth within a country. Overall, "life expectancy at older ages is becoming more unequal11. Some global regions are notably worse; for example, of the 20 countries with the worst inequality of life expectancy, all except one are in Africa12, where there is severe economic inequality between the rich and the poor.
| Inequality in Life Expectancy (2019)10 | ||
|---|---|---|
| Area | Lower is better10 | |
| Africa... | 26.10 | |
| Asia... | 11.80 | |
| Australasia | 13.47 | |
| Europe... | 4.86 | |
| North America | 11.65 | |
| South America | 12.66 | |
| The Middle East... | 9.16 | |
| World | 14.59 | |
The localities with the least inequality of life expectancy are Iceland, Hong Kong, Singapore, Japan and Slovenia10; although they're not the richest countries, they all have advanced health systems, fair social structures, and local cultures with good approaches to overall health.
The chart below shows that there is a strong correlation between a country's overall level of development, as measured by the United Nations Human Development Index8, and a reduction in inequality of life expectancy12. There are some outliers; the USA, Venezuela and Equatorial Guinea all have high levels of inequality in life expectancy compared to their overall development; this indicates some special circumstances or a failure of general social policy in those countries. Conversely countries like the Maldives and the Solomon Islands are doing very well in maintaining life, despite being relatively poor (in both those cases inequality in life expectancy is half of what you'd expect given their HDI).

Source:8
4. Genetics
#china #evolution #genetics #health #longevity
Evolution, and the process of selection, acts most strongly on the functioning of our bodies during our productive years: once we no longer have children, there is no direct pressure on evolution to provide us with good health - Dr Sweeney calls this nature's "neglect" or "lack of forethought"13.
But it's not quite that simple; social factors mean that a family's elders are often power-breakers, resource-rich and experienced, and can aid the entire family. Therefore, there is evolutionary pressure to keep elders healthy, so that they can continue to look after their offspring, and their grand-children14. This means there is slower evolutionary pressure to improve the genes that effect our longevity and good health.
“That genes play an important role in longevity has been demonstrated on many fronts. Family studies, for example, show that the male siblings of centenarians are seventeen times more likely than other men born around the same time to live to one hundred. Female siblings are eight times as likely to do so. One theory holds that the reason is that people who reach extreme old age have genetic variations throughout their genome that slow the basic mechanisms of aging and result in a decreased susceptibility to age-associated diseases. This theory is supported by the finding that throughout life the children of centenarians are significantly healthier than the children of people who die at an average age.”
"Babies by Design: The Ethics of Genetic Choice" by Ronald M. Green (2007)13
Not all the effects of ageing are a simple case of biological senescence. Some is cultural; it seems that we learn how to decline during old age. Cultures that treat the elderly in a positive and respectful manner, such as in China and the Far East in general, see their elderly develop fewer problems15.
5. Setbacks to Long Life
Disease: In Africa, expected lifespans declined in the 1990s, "owing largely to the scourge of AIDS" (2008)16, although the availability of treatments has now reversed this trend2. Diseases spread quicker in denser populations and according to traditional models, spread more quickly amongst the young and the old. Longevity can potentially make diseases more virulent in crowded and ageing countries, meaning that social care becomes increasingly important as a country develops.
Source:17
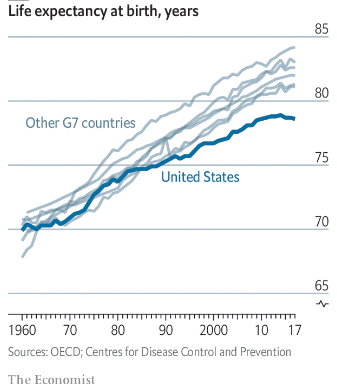
Poor Health Culture and Social Care in the USA led to improvements in life expectancy ceasing in 2010, and it is now alone in the rich world for having a declining rate.
Poverty reduces life expectancy, meaning, unpredictable cataclysms in world markets events can have negative effects on countries.
War reduces life expectancy. Not just amongst those directly in the area of the fighting, but also due to the long-term economic woes and upheaval associated with war, which spread to entire regions.
Religion: A nationally high rate of religiosity is associated with low national life expectancy (see the next section).
6. Sociological Data on Life Expectancy Versus Religion18
#causes_of_religion #china #christianity #death #islam #japan #life_expectancy #longevity #psychology #religion #USA
Christians are not the only ones who once claimed that longevity amongst believers was a sign that their religion was true - although we have seen that Muslim proponents have not made that claim. The author of "Zen - The Religion of the Samurai" (1913)19, Kaiten Nukariya19, states quite confidently that "history proves that most Zen masters enjoyed a long life in spite of their extremely simple mode of living"20, and also explains the long-lasting influence of Zen in China and Japan and elsewhere. Although it is hard to examine claims that are made for history so long ago, we can look at the world now and see if people's religions affects their long-term health. Unfortunately, the results do not come out favourably for the religious.

Source: Gallup (2009) and UNHDR (2011)21
Only countries that are still very religious have low life expectancy of below 65, and, all countries that have lost religion, or are losing it, have great life expectancy (over 65). There are only two countries that have a religiosity rate over 60% who have life expectancy of over 80yrs.
The USA typically skews statistics like this, as it is the only highly developed country with high numbers of people who consider religion to be important in their lives (65%), and, also suffers from relatively seriously health problems compared to other rich countries. But it isn't enough of an outlayer to buck the trend.
On average those who are born in countries that are not very religious enjoy 10 years longer life. Of all the countries that have life expectancy of over 80 years at birth, their average religiosity rate is merely 41.7%. Some statistics in some countries (USA) show that religious people in those countries have better health than their neighbours, however, it seems if the religious increase in numbers too much, national life expectancy will tend to be found to be much lower. In other words, mass-religiosity is bad news for longevity. As general medical science and advanced technology is tied in with good health as well as lack of poverty, there are a multitude of reasons as to why religion might be negatively correlated with long life. The only sure thing is that when the author of Proverbs 9:10-11 and 10:27 said that God-fearing folk live longer, he hadn't anticipated the rise of mass secularisation, nor the rise of science-based health improvements.